
Impact Investing and the Pandemic: Part 8
By Jory Cohen, Director of Finance and Impact Investment, Inspirit Foundation
It’s been nearly three years since the beginning of the pandemic. While life seems to have settled back into a more comfortable rhythm for many, the financial markets continue to be volatile. Following record-setting positive performance for our portfolio in 2020 — from both an absolute perspective and a relative lens compared to our benchmark — 2021 showed strong but slower growth, followed by a sharp decline in 2022.
Despite some negative performance and diminished assets in 2022, it’s also true that, relative to our benchmark, we outperformed by 1.73% in 2022. We think this is quite a feat, especially since we have no exposure to energy (oil and gas), Canada’s highest performing sector (by far!) this past year. Despite that, our portfolio held up well given the tough market conditions, performing at a rate of -7.63%, versus the benchmark’s -9.36%.
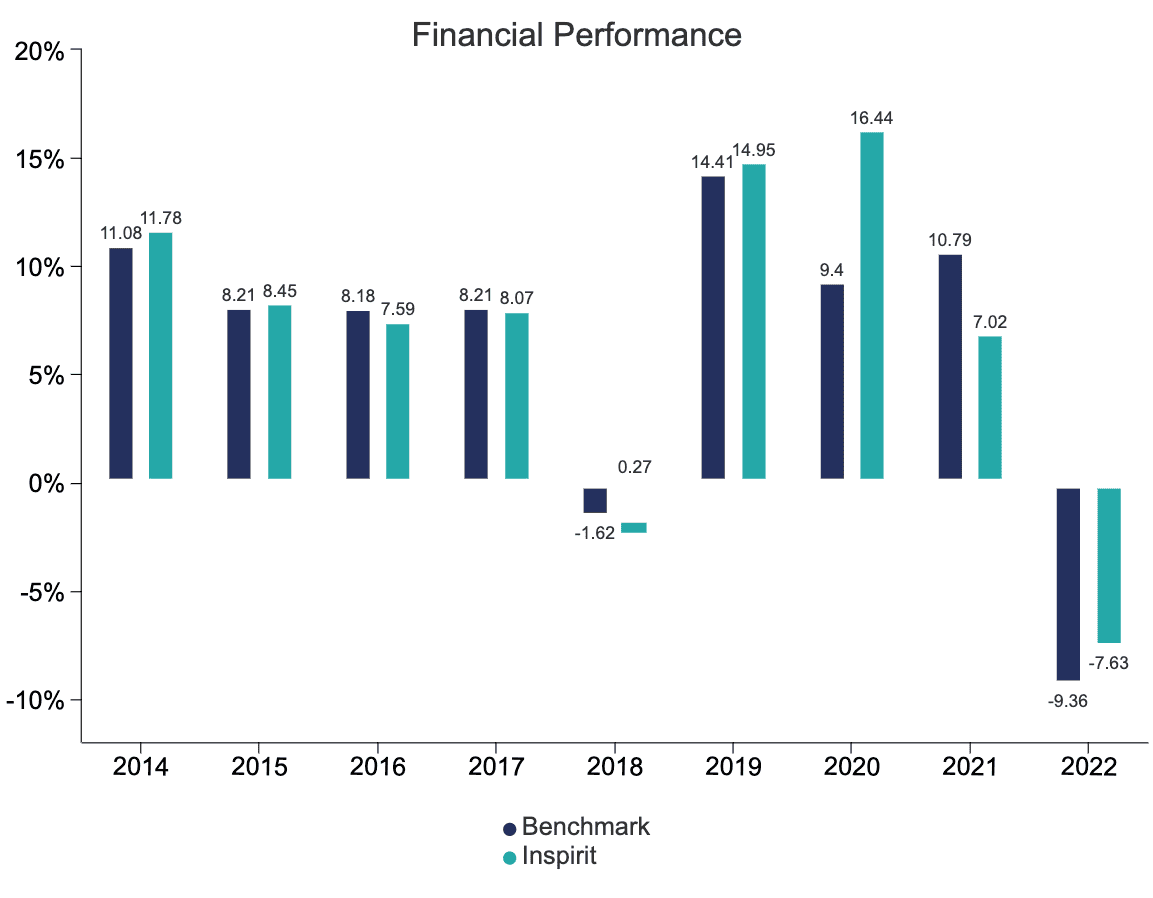
As a reminder, our benchmark is a combination of industry-standard indexes, like FTSE TMX Universe Bond for the fixed income allocation of our portfolio, S&P/TSX Composite for Canadian equities, and MSCI ACWI (CAD) for global equities. The overall benchmark is a composite of the above, weighted by investment policy target weight.
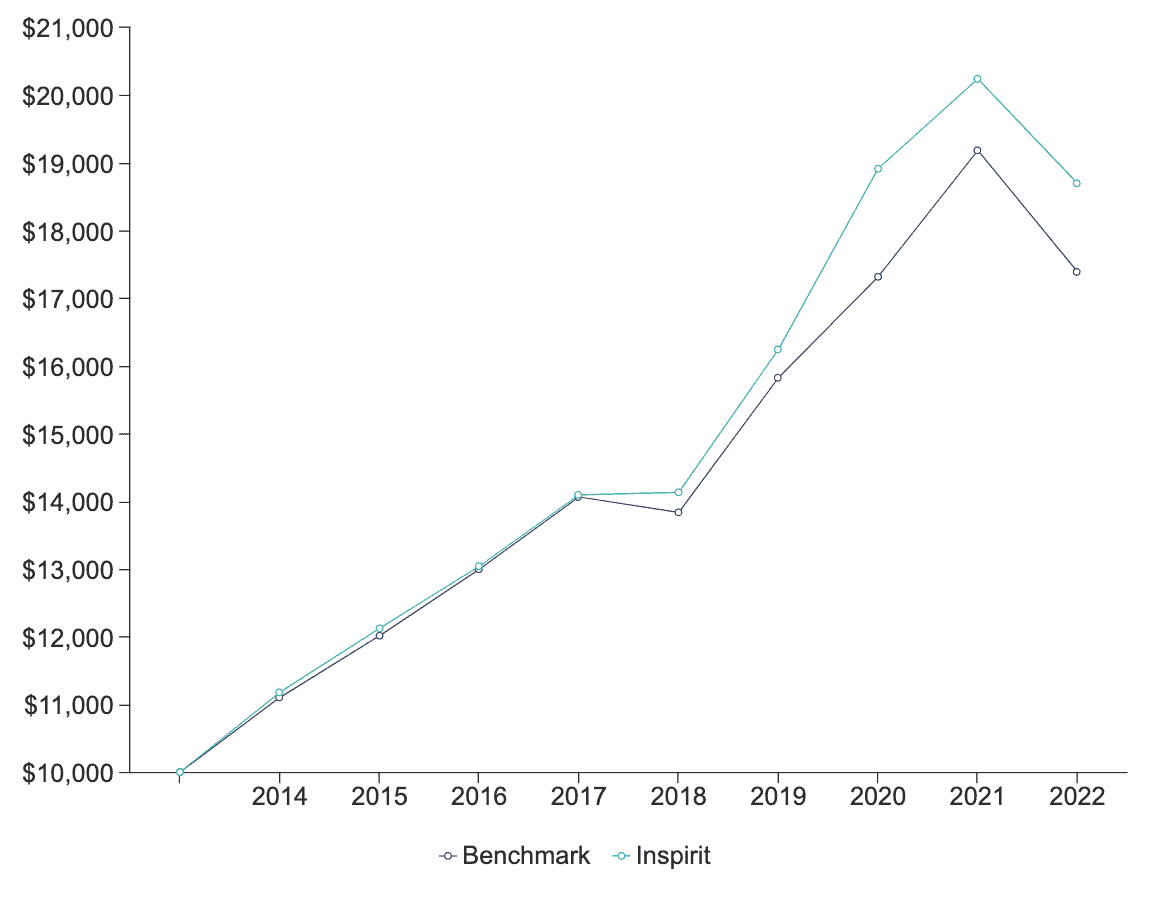
After factoring in 2022, our portfolio has outperformed benchmark by a cumulative 5.02% since inception. As the graph below demonstrates using a hypothetical investment in our portfolio compared to the benchmark, most (or more precisely – all!) of the outperformance occurred after our commitment to a 100% impact portfolio in 2016. We certainly don’t believe this is a coincidence.
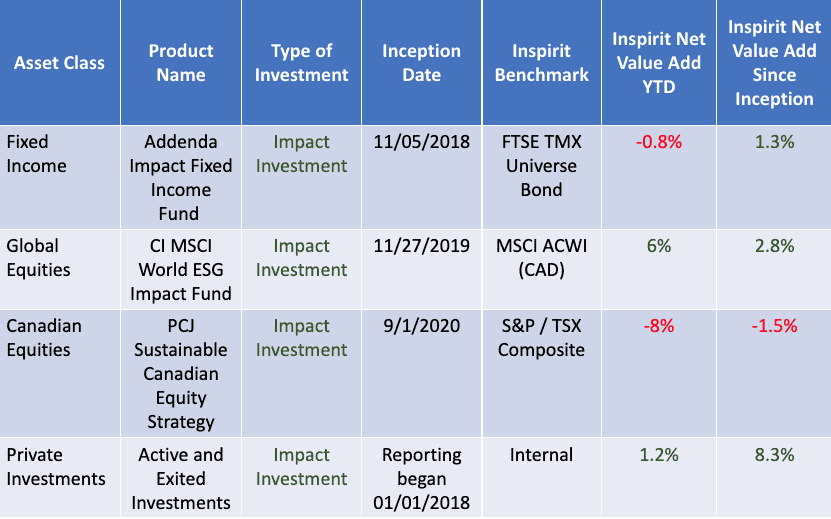
Examining performance from an asset class lens leads to some interesting observations. The fixed income portion of our portfolio continues to track benchmark, outstripping it since inception. While our global equities had a down year, performance was very strong relative to benchmark, outpacing it by 6% in 2022 and overall adding value since inception. Our Canadian equities had a rough 2022 from both absolute terms and relative to benchmark, losing ground by 8% this past year and down since the beginning of the mandate. Our private investments continue their strong and steady performance, adding some value compared to benchmark in 2022 and 8.3% of total outperformance since inception.
It’s probably worthwhile diving a bit deeper into the performance of our Canadian equities mandate. In 2022, the energy sector (oil & gas) in Canada yielded a gain of approximately 54%. There were three other sectors that netted positive results this past year – all in the single digits – and similar to energy (not the renewable kind). Inspirit didn’t have any exposure to two of them either (oil & gas storage/transmission and materials). Yikes – no wonder it was a tough year for our Canadian equities! However, we are staying committed to the mandate, and believe it will prove resilient and profitable over the long-term. We also believe it’s quite an accomplishment that our overall portfolio outperformed benchmark despite how our Canadian equities fared.
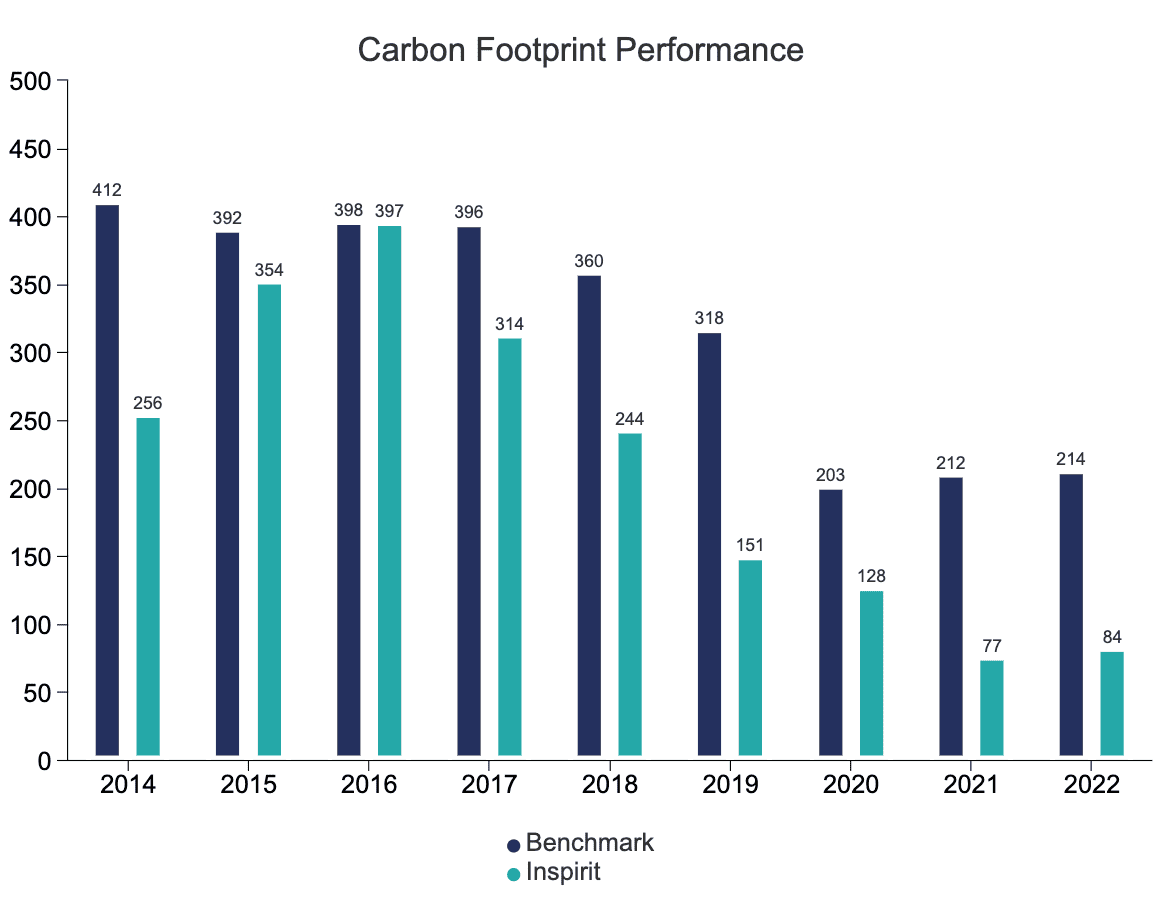
In terms of non-financial performance, our portfolio’s carbon footprint is measured by its weighted average carbon intensity – tons of carbon emitted by our portfolio companies relative to their sales – compared to benchmark. The lower, the better, and the carbon footprint of our portfolio remains limited compared to benchmark.
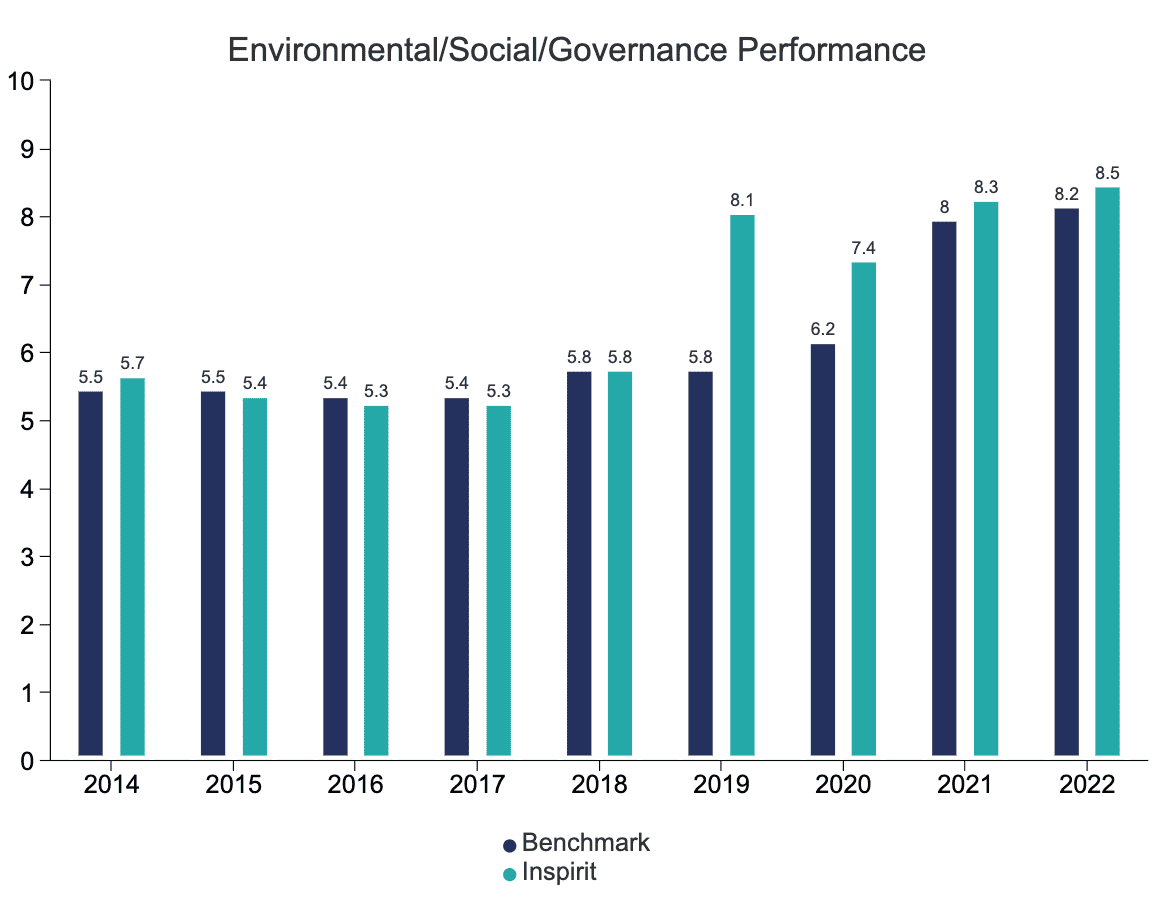
The positive impact of our portfolio is measured by two metrics. The first is an environment/social/governance (ESG) score to assess the operations of the companies in our portfolio (i.e. fairness of the supply chains, compositions of leadership etc.). This score helps us understand the internal operations of our portfolio companies and whether their values align with ours. ESG performance is calculated on a 10-point scale. Our portfolio has a strong ESG score, although it’s interesting to note that the benchmark’s ESG score is relatively high too.
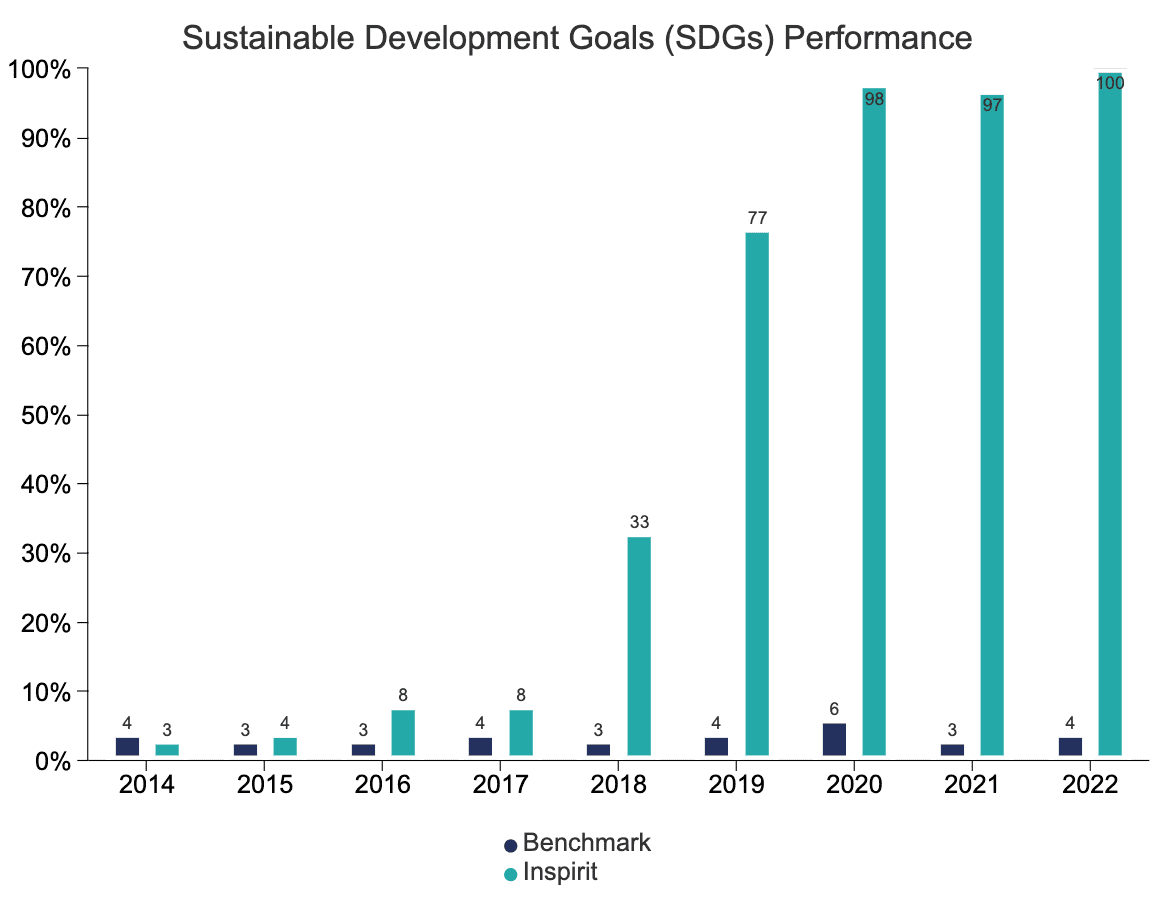
We also measure positive impact through the percentage of our portfolio that earns a majority of its revenue from products and services that contribute to the United Nations’ Sustainable Development Goals (SDGs). Analyzing how a company earns its revenue helps us understand what the company does and whether it aligns with Inspirit’s mission. Below is the percentage of our portfolio that earns a majority of its revenue from contributing to the outcomes of the SDGs, compared to the benchmark. This metric is extremely revealing, as the performance gap between our portfolio and benchmark is significant (almost as big as it gets).
By the end of 2022, we fully transitioned our portfolio to be entirely composed of impact investments. While we’ll never really be fully satisfied with our portfolio, we’ll continue to iterate along the way…even in the midst of market volatility.