
Impact Investing and the Pandemic: Part 4
Looking back, 2020 was an unprecedented year as a pandemic affected every area of our lives, including the markets. It was also an unprecedented year for Inspirit’s investments and our overall portfolio.
Prior to 2020, Inspirit’s cumulative net value-added performance since inception (2014), that is, our portfolio’s net returns versus benchmark, was a total of 2.7%. While that outperformance figure is nothing to scoff at, 2020 was certainly a turning point for our investments. In 2020 alone, Inspirit’s portfolio added 7.04% in net value relative to benchmark, raising the cumulative net value-added performance since inception to an astonishing 9.74%.
For reference, Inspirit compares our portfolio’s performance relative to an industry-standard benchmark. Our benchmark is a combination of industry-standard indexes, like FTSE TMX Universe Bond for the fixed income allocation of our portfolio, S&P/TSX Composite for Canadian equities, and MSCI ACWI (CAD) for global equities. The overall benchmark is a composite of the above, weighted by investment policy target weight.
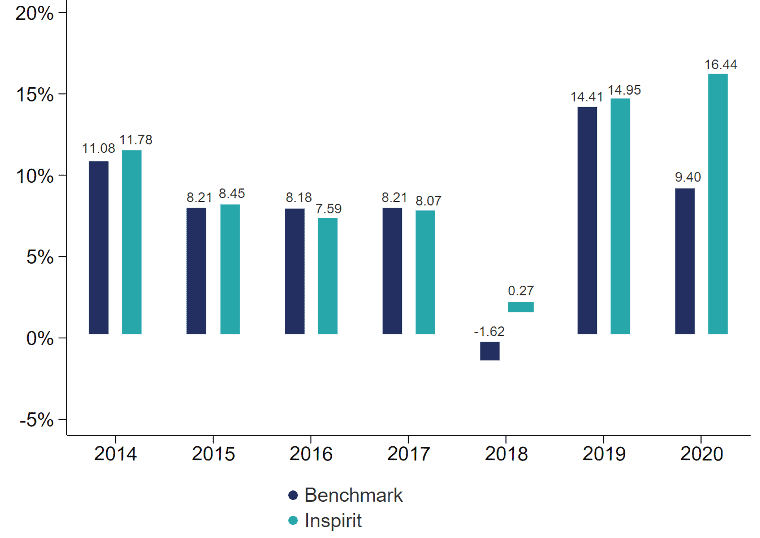
Our portfolio’s performance this year was 16.44% net of fees, relative to benchmark performance of 9.4%. The graph below shows Inspirit’s annual net performance since inception. You’ll notice the (out)performance gap in 2020.
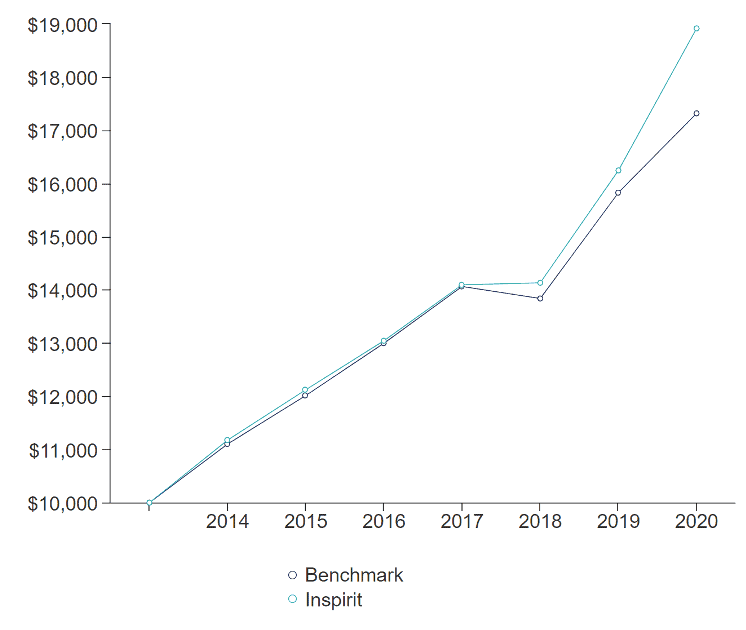
Another way to track our net financial performance to date is through a hypothetical $10,000 in our portfolio versus benchmark since inception. Again, you can see how our portfolio significantly deviates (in a good way) from benchmark in 2020.
Let’s take a deeper look into what drove such strong performance this year. Below is a breakdown of Inspirit’s portfolio by asset class. All performance and value add is net of fees.
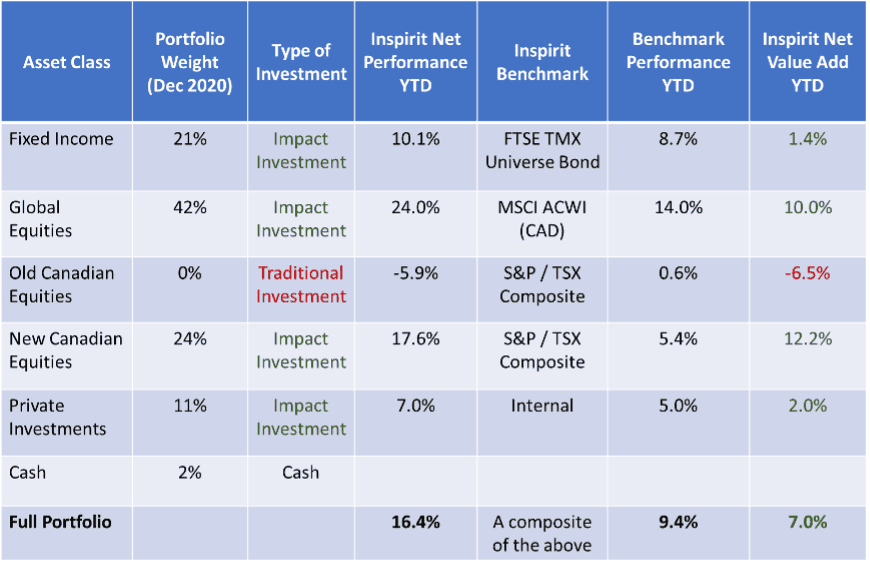
If you take a look at the far right-hand column, you’ll see the net value add of each asset class relative to benchmark during 2020. The only underperforming investment was our former Canadian equities mandate, which was the last asset class (besides cash) to transition to increase its impact. All the other asset classes, all impact investments, outperformed – and some significantly so.
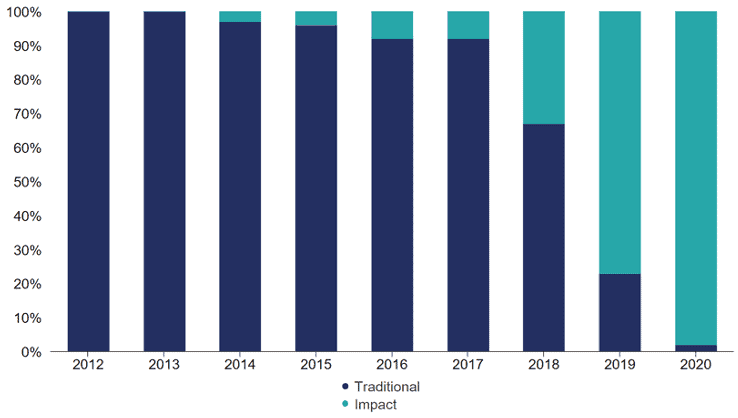
As at the end of 2020, 98% of our portfolio can be considered impact investments. Only our cash remains idle from an impact perspective, but that’s something that we’ll be working on in 2021.
With every asset class (except cash) generating positive impact, the table below shows performance by asset class since inception. All performance and value add is net of fees. The far right-hand column is a breakdown of net cumulative outperformance versus benchmark for each investment. Look at all that value-add so far.
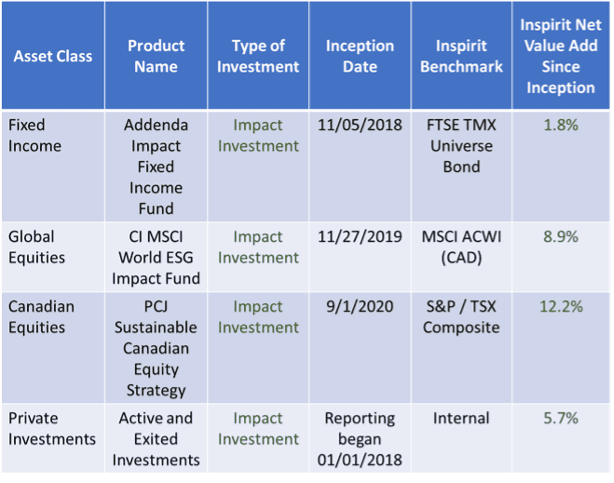
Here are a couple of other highlights from the table:
- Fixed income is a tough asset class to outperform benchmark. Adding 1.8% of net value relative to benchmark in about two years is a feat.
- In just over a year, our global equities have added just under 9% in net value relative to benchmark. This is a rare accomplishment, bringing our net gain in 2020 for this asset class to 24%. For context, the annual growth rate of the S&P 500 index from 1957-2018 is under 8%, so a 24% increase in a single year is a lot!
- We transitioned to an all-cap Canadian equities mandate in September of 2020. What a start to the mandate! Our Canadian equities are a mix of small, mid, and large companies with a focus on industries such as clean energy, healthcare, and other impact-oriented sectors.
- We have made 20 private investments to date, with four exits. All private investments have performed either as expected or better. We have never had to impair (write down) an investment to date.
To keep tabs on our portfolio’s performance from both a financial and impact perspective, check out the Our Performance page on Inspirit’s website.
Like others in philanthropy, we are hoping for more stability, recovery, and health in every sector in 2021, all while paying close attention to what happens in the impact investing world.