Impact Investing and the Pandemic: Part 6
By Jory Cohen, Director of Finance and Impact Investment
The past two years have been a reminder of devastation, turmoil, and fear across the globe.
This past year was also tumultuous for Inspirit’s portfolio. In 2021, energy (primarily fossil fuels) and financials were the biggest sector performers in Canada. Given Inspirit’s focus on companies that generate positive social and environmental impact, any period where oil & gas and banks are the strongest drivers of growth is likely to be an extremely challenging time for our portfolio. Our investments trailed the benchmark; fortunately, the margin wasn’t as wide as expected
For reference, Inspirit compares our portfolio’s performance relative to an industry-standard benchmark. Our benchmark is a combination of industry-standard indexes, like FTSE TMX Universe Bond for the fixed income allocation of our portfolio, S&P/TSX Composite for Canadian equities, and MSCI ACWI (CAD) for global equities. The overall benchmark is a composite of the above, weighted by investment policy target weight.
In 2021, Inspirit’s portfolio generated returns of 7.02% versus the benchmark return of 10.79%, a relative underperformance of 3.77%. While our returns lagged the benchmark, we were pleased with the resilience of our portfolio (because the bottom line could have been a lot worse!). While it’s true that 2021 was a down year relative to benchmark, Inspirit’s portfolio has outperformed since inception, with stronger relative performance in recent years.
Below is our portfolio’s performance since 2014, the year Inspirit began investing:
While 2021 was a tough year for our investments, it certainly didn’t erase the positive performance gap from 2020, a year of outsized returns. Our portfolio’s focus on impact-oriented sectors like healthcare and clean energy paid dividends, leading to significant outperformance of our benchmark. We earned a net return of 16.44% compared to the benchmark return of 9.4%. That’s a net value add of 7.04%; a massive (out)performance gap!
Looking at financial performance in another way, below is a hypothetical $10,000 investment in our portfolio versus the benchmark since inception. Despite relative underperformance in 2021, an investment in our portfolio years ago would still result in more financial success compared to the benchmark.
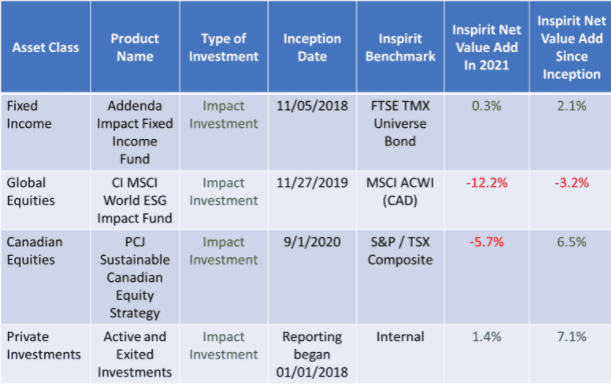
Analyzing performance by asset class yields interesting results. The table below displays figures for each of our main asset classes. While our public fixed income and private investments outperformed benchmark in 2021, our global equities and Canadian equities underperformed, and did so significantly (although we really do feel it could have been much worse). It’s certainly worth noting that every asset class but our global equities have outperformed benchmark since inception (take a look at the most right-hand column). We believe this is quite a feat!

By the end of 2021, 97% of our portfolio had shifted to increase its impact while we looked for a home for the final 3%, our cash. Fortunately, this past year we selected Vancity Community Investment Bank (VCIB) as a new home for our cash. VCIB has a mandate to leverage all our (and their other clients’) deposits as loans to affordable housing projects, clean energy initiatives, and social enterprises. We expect to transfer the cash portion of our portfolio to VCIB by the end of this year, which would bring us to our goal of a 100% impact portfolio even as we recognize that we need to be consistently increasing the impact of our portfolio moving forward.
As we welcome spring, we are collectively hoping for stability and security during what has already been a volatile 2022.